35 Prediction Motivation
This will cover the basic ideas behind machine learning and prediction.
- Study Design - Training vs Tests
- Conceptual issues - Out of sample error & ROC curves
- Practical implementation - The
caretpackage
35.1 Who Predicts?
- Local governments - Pension payments
- Google - Ad preferences
- Amazon/Netflix - Suggestion Models
- Insurance Companies - Risk of death
- Uni - Successes in programs
View The Elements Of Statistical Learning
View Stanford Machine Learning Ng Course
View Notes from MIT Open Courseware
35.2 What is Prediction?
If we start with a dataset containing blue and orange dots, from all data we’ll use probability/sampling to create a training set that we’ll use to define a prediction function that will take a dot of unknown color and using predictors, it will separate out these two colors of dots. Then we will view whether these predictions are correct or not.
Prediction/Sampling is extremely important and often overlooked, looking further into this. (Parable of Google Flu)
35.3 Components of a Predictor
- Question - Very specific and well defined. What are you trying to predict and what are you trying to predict it with?
- Input-data - Best possible.
- Features - Measured characteristics that we have, or use computation to build useful features.
- Algorithm
- Parameters - Estimate parameters of the algorithms and use the parameters to apply the algorithm to a new dataset for evaluation.
- Evaluation
35.3.1 SPAM example
- Start with a general question
- Can I automatically detect emails that are spam?
- Make it concrete
- Can I use quantitative characteristics of the emails to classify them as SPAM/HAM?
##   make address  all num3d  our
## 1 0.00    0.64 0.64     0 0.32
## 2 0.21    0.28 0.50     0 0.14
## 3 0.06    0.00 0.71     0 1.23
## 4 0.00    0.00 0.00     0 0.63
## 5 0.00    0.00 0.00     0 0.63
## 6 0.00    0.00 0.00     0 1.85
# Spam mails have more frequent uses of the word "Your"
plot(density(spam$your[spam$type=="nonspam"]), col = "blue", main="", xlab="Frequency of 'Your'")
lines(density(spam$your[spam$type=="spam"]), col = "red")
abline(v=0.3, col = "black")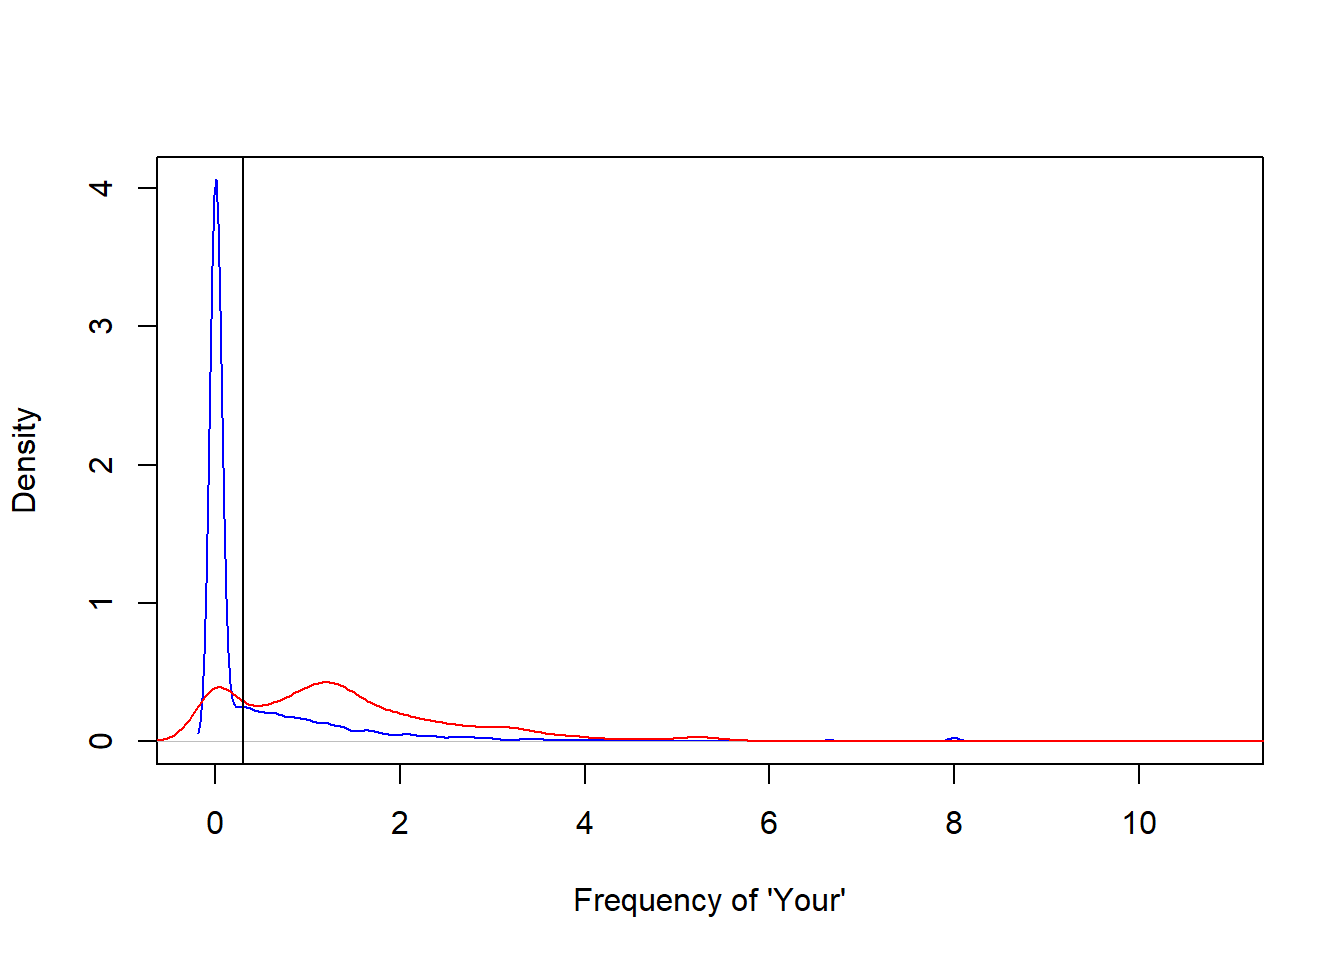
From the plot above, we could build a simple model to predict spam mails by only using the value ‘C’:
Our simple algorithm:
- Find the value ‘C’
- Frequency of ‘Your’ > C - predict “SPAM”
prediction <- ifelse(spam$your > 0.5, "spam", "nonspam")
table(prediction, spam$type)/length(spam$type)
##
## prediction nonspam spam
## nonspam 0.4590306 0.1017170
## spam 0.1469246 0.2923278Accuracy = 0.459 + 0.292 = 0.751