12 Power
We’ve talked about a Type I error, rejecting the null hypothesis when it’s true. We’ve structured our hypothesis test so that the probability of this happening is small. The other kind of error we could make is to fail to reject when the alternative is true (Type II error). Or we might think about the probability of rejecting the null when it is false. This is called Power = 1 - Type II error. We don’t have as much control over this probability, since we’ve spent all of our flexibility guaranteeing that the Type I error rate is small.
One avenue for the control of power is at the design phase. There, assuming our finances let us, we can pick a large enough sample size so that we’d be likely to reject if the alternative is true. Thus the most frequent use of power is to help us design studies.
Power is the probability of rejecting the null hypothesis when it is false. Power is a good thing. You want more power.
Power comes more into play when you fail to reject the null hypothesis.
- A Type II error is when you fail to reject the null hypothesis when it is false. The probability of getting a type II error is \(\beta\).
\[Power=1-\beta\]
12.1 Example
Consider our previous example using RDI:
- \(H_0:\mu=30\) versus \(H_a:\mu > 30\)
Then Power would be:
\[P( \frac{\bar{X}-30}{\frac{s}{\sqrt{n}}} > t_{1- \alpha, ~n-1}; \mu = \mu_a)\]
- Note that this is a function that depends on the specific value of \(\mu_a\).
- Notice as \(\mu_a\) approaches 30, the power approaches \(\alpha\)
12.2 Calculating Power
We reject if \(\frac{\bar{X}-30}{\frac{\sigma}{\sqrt{n}}} > z_{1-\alpha}\).
- Equivalently if \(\bar{X} > 30 + Z_{1-\alpha \frac{\sigma}{\sqrt{n}}}\)
Under \(H_0 : \bar{X} \sim N(\mu_0, \frac{\sigma^2}{n})\) Under \(H_a : \bar{X} \sim N(\mu_a, \frac{\sigma^2}{n})\)
12.3 Example Continued
\(\mu_a = 32, ~\mu_0 = 30, ~ n = 16, ~ \sigma = 4\)
# Assign values:
alpha = 0.05
mu0 = 30
mua = 32
sigma = 4
n = 16

z <- qnorm(1 - alpha)

pnorm(mu0 + z * sigma/sqrt(n), mean = mu0, sd = sigma/sqrt(n), lower.tail = FALSE)
## [1] 0.05## [1] 0.63876myplot <- function(sigma, mua, n, alpha){
g = ggplot(data.frame(mu = c(27, 36)), aes(x = mu))
g = g + stat_function(fun = dnorm, geom = "line",
args = list(mean= mu0, sd = sigma/sqrt(n)),
size = 2, col = "red")
g = g + stat_function(fun = dnorm, geom = "line",
args = list(mean = mua, sd = sigma /sqrt(n)),
sinze = 2, col = "blue")
xitc = mu0 + qnorm(1 - alpha) * sigma/sqrt(n)
g = g + geom_vline(xintercept = xitc, size = 3)
g
}## Warning: Ignoring unknown parameters: sinze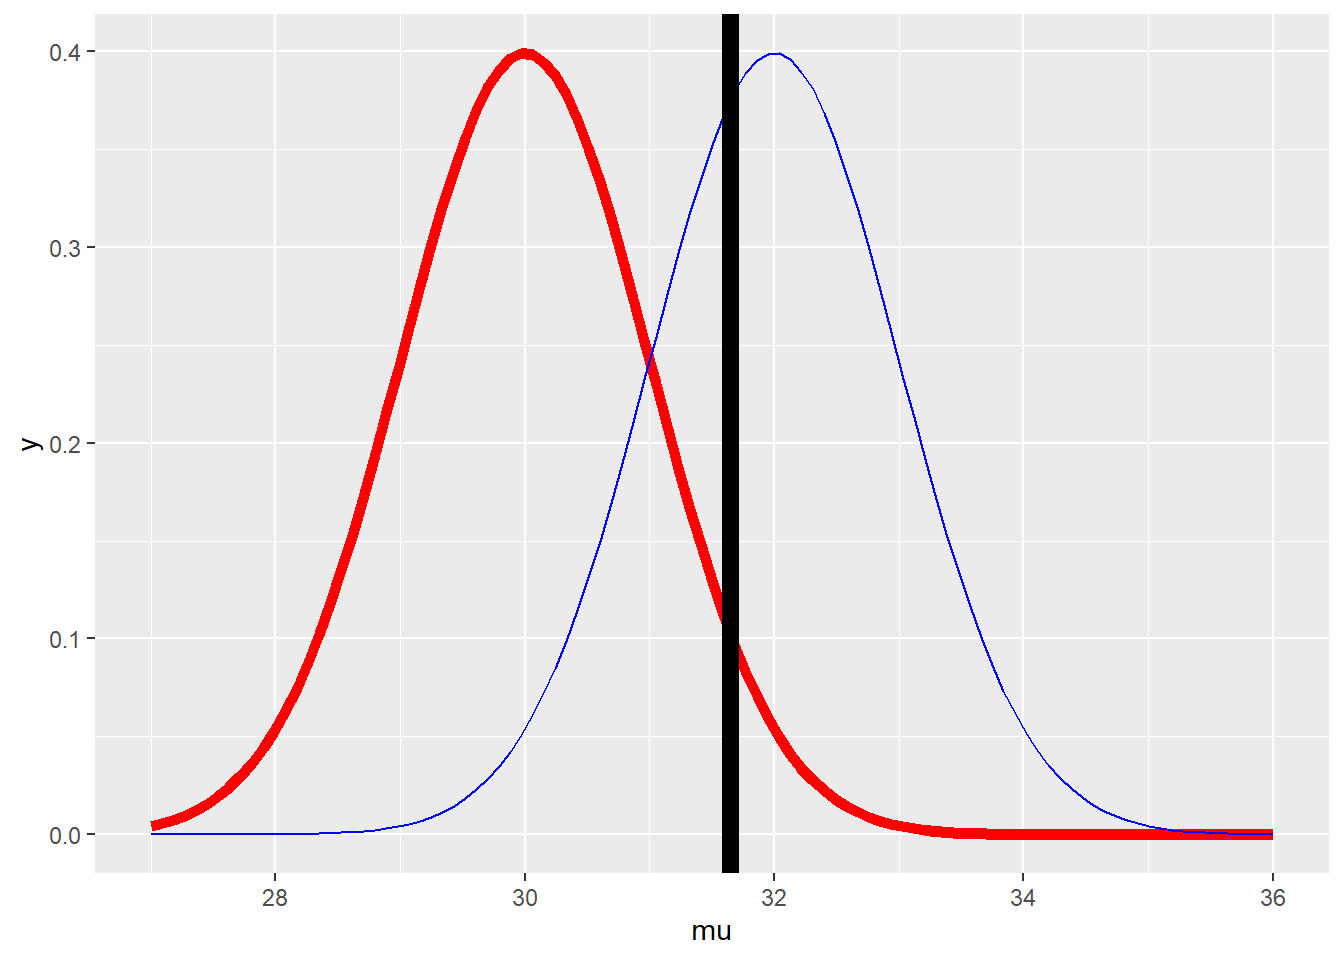
12.4 Question
- When testing \(H_a~:~\mu>\mu_0\), notice, that if the power is \(1-\beta\), then:
\[1-\beta = P(\bar{X}~~>~~\mu_0 + z_{1-\alpha} \frac{\sigma}{\sqrt{n}};~\mu=\mu_a )\]
Where:
- \(\bar{X} \sim N(\mu_a, ~\frac{\sigma^2}{n})\)
- Unknowns: \(\mu_0, \sigma, n, \beta\)
- Known: \(\mu_0, \alpha\)
- Specify any 3 of the unknowns and you can solve for the remainder
12.5 Notes:
- The calculation for \(H_a : \mu < \mu_0\) is similar.
- For \(H_a : \mu \ne \mu_0\), calculable the one sided power using \(\alpha/2\) (This is only approximately right, it excludes the probability of getting a large TS in the opposite direction of the truth)
- Power goes up as \(\alpha\) gets bigger.
- Power of a one sided test is greater than the power of the associated two sided test
- Power goes up as \(\mu_1\) gets further away from \(\mu_0\)
- Power goes up as \(n\) goes up
Interestingly, Power does not need \(\mu_a, \sigma ~~ and~~ n\), instead only:
\[\frac{\sqrt{n}(\mu_a-\mu_0)}{\sigma}\] This quantity is known as the Effect Size, this is the difference in the means, in standard deviation units.
12.6 T-Test Power
Power is never really calculated in the way shown above, this is more of an explanation. Most frequently, we can just use the power.t.test() function.
- Consider calculating the power for a Gossett’s T test for our example.
- Calculating this requires the non central t distribution.
- The power would be:
\[P(\frac{\bar{X}-\mu_0}{S/\sqrt{n}}~>~t_{1-\alpha, n-1}; ~ \mu=\mu_a)\]
12.6.1 Example
# Delta here, is the difference in the means
power.t.test(n=16, delta = 2/4, sd = 1, type = "one.sample", alt = "one.sided")$power
## [1] 0.6040329# Delta = 2, Sd = 4
power.t.test(n=16, delta = 2, sd = 4, type = "one.sample", alt = "one.sided")$power## [1] 0.6040329# Delta = 100, Sd = 200
power.t.test(n=16, delta = 100, sd = 200, type = "one.sample", alt = "one.sided")$power## [1] 0.6040329# This formula can be used to get the value of 'n' also
power.t.test(power = 0.8, delta = 2/4, sd = 1, type = "one.sample", alt = "one.sided")$n## [1] 26.13751## [1] 26.13751## [1] 26.13751